Rising Stars: Analyzing NHL Draft Prospects Through NHLe Rankings

This is my submission for the Utah Hockey Club Summer Analytics Challenge.
In the NHL, points are king. The more points a player scores, the more valuable they become - driving wins, attracting fans, and selling jerseys. But finding these top-tier scorers is like searching for a needle in a haystack. Sure, you might luck out with a #1 draft pick, but even those aren’t guaranteed hits. And trading for a superstar? You’d need to sell the farm and then some.
So what’s the most realistic approach? Draft and develop. It’s a long game, but it’s how dynasties are built. This approach is essential for the Utah Hockey Club looking to establish itself in the NHL. As a lifelong fan of the Red Wings, I’ve seen firsthand how painfully slow this process can be (but I still believe in the Yzerplan). Even with a solid development program, turning a franchise around takes time.
This is where scouting becomes crucial. But there’s only so much you can see with the naked eye. Stats tell a big part of a player’s story, especially for young prospects. The problem? Not all leagues are created equal. A player dominating junior hockey might not translate to NHL success, while a modest performer in a tougher league could be a hidden gem. For Utah, accurately evaluating talent across different leagues will be key to making smart draft choices and roster decisions to build a strong foundation for the future.
That’s where NHL Equivalency (NHLe) comes in. It’s a tool that aims to level the playing field, allowing us to compare prospects across different leagues. And that’s what I set out to explore - using NHLe to evaluate the upcoming 2025 NHL draft prospects and potentially uncover some overlooked talent.
NHL Equivalency
NHL Equivalency has been around since the early 2000’s when Gabriel Desjardins adapted it for hockey from a similar concept in baseball. The idea is pretty straightforward: assign a value to each league that represents how its points translate to NHL points. So if a player scores 100 points in a league with a 0.5 NHLe, that’s equivalent to 50 NHL points. Simple, right?
The classic NHLe model compares players’ scoring rates between leagues and the NHL, typically in the same season or adjacent seasons. This approach inherently accounts for player development among these seasons and mitigates outliers, like Connor McDavid scoring 209 points in U16 AAA, by using league-wide averages. However, it has significant limitations: it can’t handle leagues without direct NHL transitions, it undervalues defensemen due to its focus on scoring, and fails to account for goalies altogether.
To address the limitation of leagues without direct NHL transitions, CJ Turtoro developed the Network NHLe approach. This method calculates league equivalencies using indirect paths to the NHL. While I’ll explain the calculation method later, you can get a good overview from CJ’s piece or Patrick Bacon’s article (links provided at the end). My plan was to use these values to determine each prospect’s average NHLe since 2022-2023 and rank them. However, the available NHLe data predated 2020 and some leagues lacked values altogether. Consequently, I decided to calculate the NHLe values myself.
My Approach
To ensure our analysis reflects the current hockey landscape, I decided to update the NHLe values myself. Here’s how I approached it:
-
Data Collection: I scraped over 1.2 million player seasons from the 2010-2011 season up to the 2023-2024 season, omitting the 2012-2013 season due to the NHL lockout.
-
League Coverage: I included data from over 120 leagues worldwide, including World Juniors (U18 & U20), USA and Canada AAA leagues, and International Jr. Play. I figured this would give me the most accurate values and would limit how the data is skewed.
-
Consolidation: For AAA leagues, I consolidated NHLe values into categories like U15 AAA-USA, U15 AAA-Canada, U16 AAA-USA, etc., using data from top leagues in each category.
-
Calculation Method: To calculate NHLe values, I first analyzed player transitions between leagues, computing initial equivalencies using the basic equation below. I only considered league transitions that had a minimum of 10 player’s transitioning.

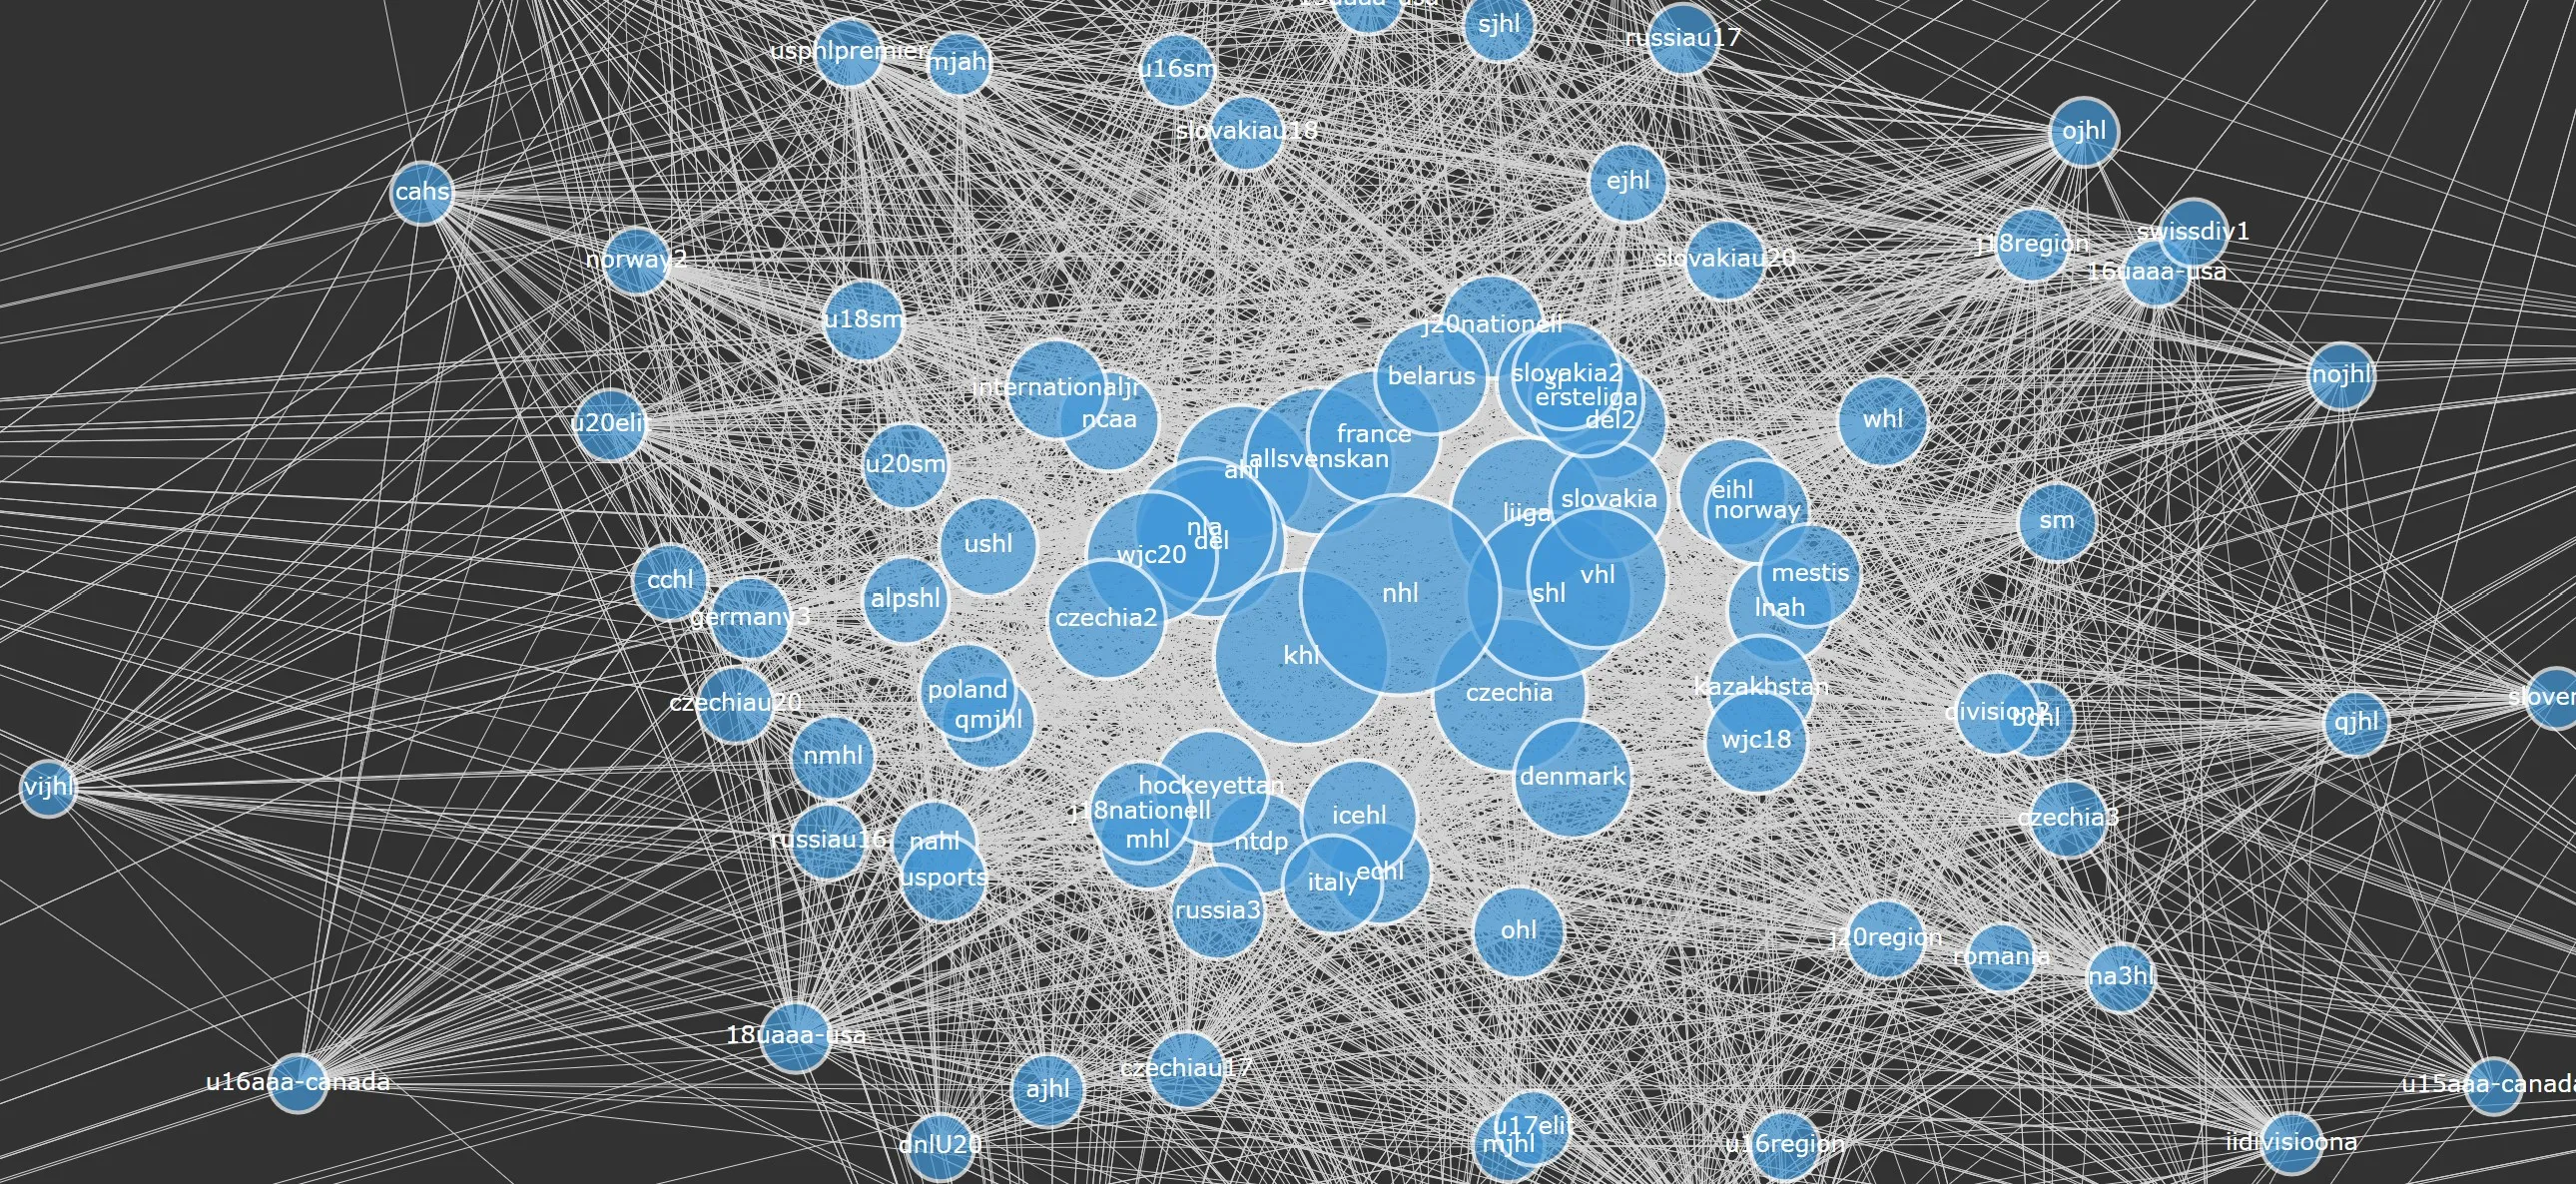
I then created a directed graph representing the network of leagues and their connections.

I’ve developed an interactive dashboard that visualizes player transitions between hockey leagues. You can explore it here: https://league-network-dashboard-d6ac64fae206.herokuapp.com/
The dashboard offers a comprehensive view of player movements for any selected league. Each node represents a different league, with its size indicating the league’s NHL Equivalency (NHLe) value. The node’s proximity to the NHL node reflects how direct the pathways are from that league to the NHL. When you select a specific league, the dashboard displays the subsequent destinations of all players who transitioned out of that league.
From this, I identified the top 50 shortest paths to the NHL from each league. The paths were then weighted based on their length and the number of player transitions, prioritizing shorter, more common routes. These are the routes NHL-level talent would take, although there are always those few players who work their way to the NHL through an unorthodox path.

The final NHLe for each league was determined by combining these weighted path values, accounting for both direct and indirect paths to the NHL.
This is a set of updated NHLe values for a wide range of leagues, providing a more accurate basis for comparing prospects across different competitions:
NHL League NHLe Table
| Rank | League | NHLe |
|---|---|---|
| 1 | NHL | 1.000 |
| 2 | KHL | 0.762 |
| 3 | SHL | 0.694 |
| 4 | Liiga | 0.599 |
| 5 | Czechia | 0.599 |
| 6 | DEL | 0.556 |
| 7 | Allsvenskan | 0.549 |
| 8 | NLA | 0.496 |
| 9 | VHL | 0.487 |
| 10 | AHL | 0.461 |
| 11 | France | 0.445 |
| 12 | WJC-20 | 0.431 |
| 13 | Slovakia | 0.355 |
| 14 | Czechia2 | 0.354 |
| 15 | Denmark | 0.353 |
| 16 | ICEHL | 0.338 |
| 17 | HockeyEttan | 0.331 |
| 18 | Erste Liga | 0.327 |
| 19 | SL | 0.324 |
| 20 | DEL2 | 0.320 |
| 21 | Belarus | 0.319 |
| 22 | EIHL | 0.295 |
| 23 | Slovakia2 | 0.292 |
| 24 | Kazakhstan | 0.291 |
| 25 | LNAH | 0.282 |
| 26 | Norway | 0.273 |
| 27 | J20 Nationell | 0.269 |
| 28 | WJC-18 | 0.267 |
| 29 | ECHL | 0.265 |
| 30 | J18 Nationell | 0.262 |
| 31 | Mestis | 0.262 |
| 32 | NTDP | 0.262 |
| 33 | NCAA | 0.254 |
| 34 | International Jr | 0.253 |
| 35 | USHL | 0.246 |
| 36 | Italy | 0.244 |
| 37 | Poland | 0.235 |
| 38 | MHL | 0.233 |
| 39 | Russia3 | 0.226 |
| 40 | QMJHL | 0.223 |
| 41 | OHL | 0.213 |
| 42 | WHL | 0.209 |
| 43 | AlpsHL | 0.190 |
| 44 | U20 SM-sarja | 0.189 |
| 45 | U Sports | 0.187 |
| 46 | NAHL | 0.184 |
| 47 | NMHL | 0.179 |
| 48 | Division 2 | 0.176 |
| 49 | Germany3 | 0.169 |
| 50 | U18 SM-sarja | 0.167 |
| 51 | Slovakia U20 | 0.166 |
| 52 | EJHL | 0.159 |
| 53 | SM-liiga | 0.158 |
| 54 | J20 Region | 0.157 |
| 55 | Czechia3 | 0.153 |
| 56 | BCHL | 0.151 |
| 57 | Czechia U17 | 0.151 |
| 58 | Czechia U20 | 0.149 |
| 59 | Russia U16 | 0.148 |
| 60 | CCHL | 0.145 |
| 61 | Slovakia U18 | 0.144 |
| 62 | U17 Elit | 0.143 |
| 63 | U16 SM-sarja | 0.139 |
| 64 | J18 Region | 0.139 |
| 65 | AJHL | 0.136 |
| 66 | SJHL | 0.131 |
| 67 | MJHL | 0.131 |
| 68 | U20 Elit | 0.130 |
| 69 | Russia U17 | 0.129 |
| 70 | 15U AAA (USA) | 0.127 |
| 71 | 18U AAA (USA) | 0.125 |
| 72 | U16 Region | 0.123 |
| 73 | Romania | 0.122 |
| 74 | NA3HL | 0.120 |
| 75 | OJHL | 0.120 |
| 76 | USPHL Premier | 0.120 |
| 77 | Swiss Div1 | 0.116 |
| 78 | 16U AAA (USA) | 0.115 |
| 79 | DNL U20 | 0.115 |
| 80 | Norway2 | 0.114 |
| 81 | NOJHL | 0.113 |
| 82 | QJHL | 0.109 |
| 83 | USHS-Prep | 0.109 |
| 84 | MJAHL | 0.104 |
| 85 | Belarus Vysshaya | 0.104 |
| 86 | Russia U18 | 0.102 |
| 87 | Denmark2 | 0.101 |
| 88 | CAHS | 0.099 |
| 89 | II-divisioona | 0.096 |
| 90 | Slovenia | 0.094 |
| 91 | Denmark U20 | 0.091 |
| 92 | GOJHL | 0.091 |
| 93 | U18 AAA (Canada) | 0.089 |
| 94 | USHS-MN | 0.088 |
| 95 | KIJHL | 0.087 |
| 96 | U20 Top | 0.085 |
| 97 | U16 AAA (Canada) | 0.085 |
| 98 | U15 AAA (Canada) | 0.080 |
| 99 | VIJHL | 0.079 |
| 100 | Germany U17 | 0.070 |
| 101 | J20 Div.1 | 0.070 |
| 102 | U16 Div.1 | 0.064 |
| 103 | J18 Div.1 | 0.062 |
| 104 | Division 4 | 0.060 |
| 105 | DNL U20 2 | 0.053 |
| 106 | J20 Div.2 | 0.053 |
| 107 | U16 Div.2 | 0.046 |
| 108 | Denmark U18 | 0.045 |
| 109 | PJHL | 0.030 |
Rankings
With our updated NHLe values in hand, I applied them to a list of 139 prospects for the 2025 NHL draft, obtained from EliteProspects.com. Here is how I ranked the prospects:
-
I calculated NHLe score for each prospect’s draft year minus 2 (DY-2) and draft year minus 1 (DY-1) season. With their draft year being 2025, these correspond to the 2022-2023 and 2023-2024 seasons. Their draft year (DY) season has yet to be played so I did not use that in these rankings.
-
For each season, I calculated the NHLe for each league a prospect played in. For players in multiple leagues (e.g., USHL and NTDP), I computed the NHL equivalent PPG for each league using its respective NHLe, then averaged these values to get the season’s total NHL equivalent PPG.
-
I ranked the prospects within each season based on NHLe scores.
-
These rankings were then combined using a weight applied to each season’s ranking. DY-2 rankings were assigned a weight of 1.2 and DY-1 rankings were assigned a weight of 1.1. DY rankings would be assigned a weight of 1 if they were included. This weighting system balances early success with recent performance, preventing prospects from dominating the rankings based solely on strong performances in potentially easier leagues. (I may update these weights in the future, but for now they are sufficient.)
-
The final draft board was determined by the lowest combined weighted rankings (like a golf score).
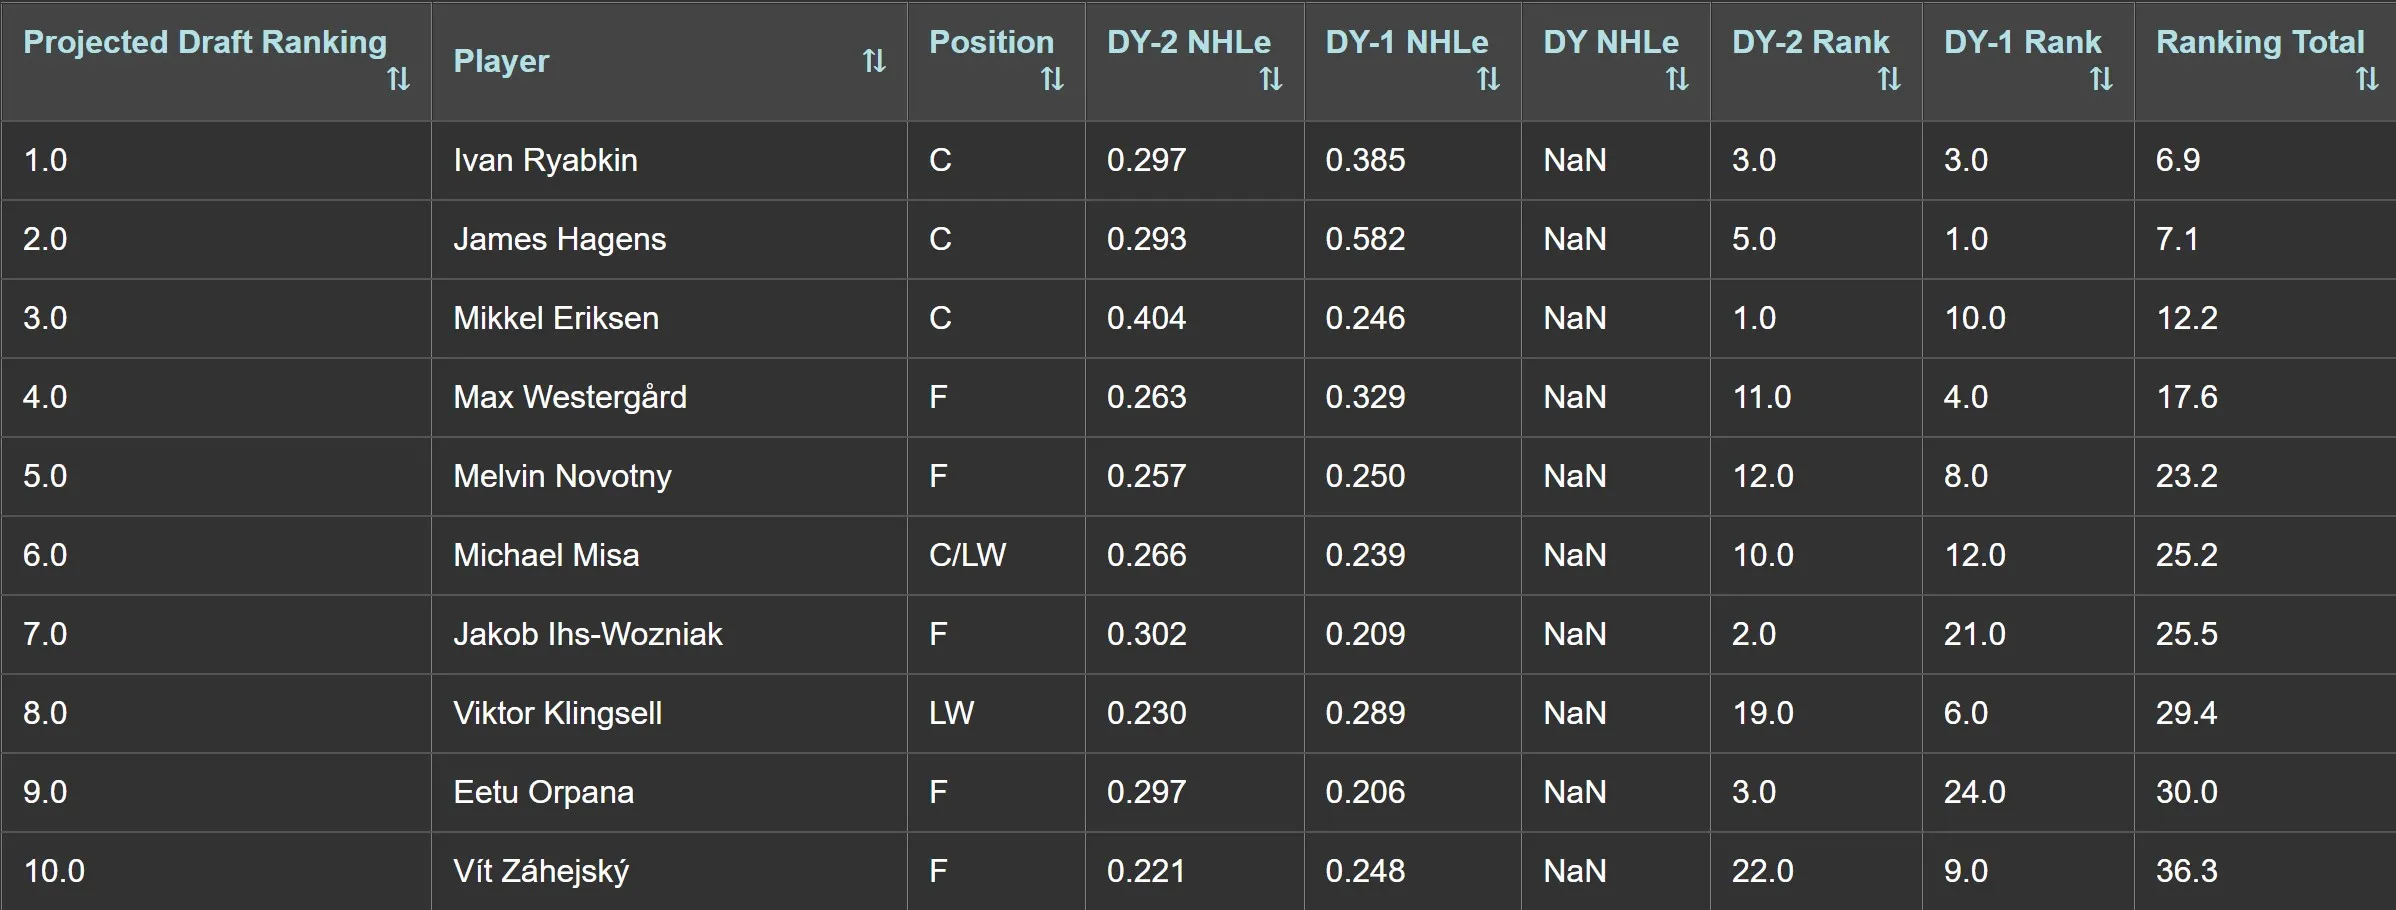
These are the top 10 2025 NHL draft prospects according to my rankings:

When I completed the rankings, I found myself unsure of what to make of them. I had the results, but no real context to understand them. Since I wasn’t familiar with many of these prospects, it was hard to judge if the rankings truly reflected their ability.
To address this, I decided to apply my methodology to every NHL Draft class from 2014 to 2024, to test the effectiveness of my approach. This allowed me to compare my rankings with actual draft results and subsequent NHL performance. (For the 2014 and 2015 draft classes, the seasons corresponding to the 2012-2013 NHL lockout were omitted for the reason I mentioned before.)
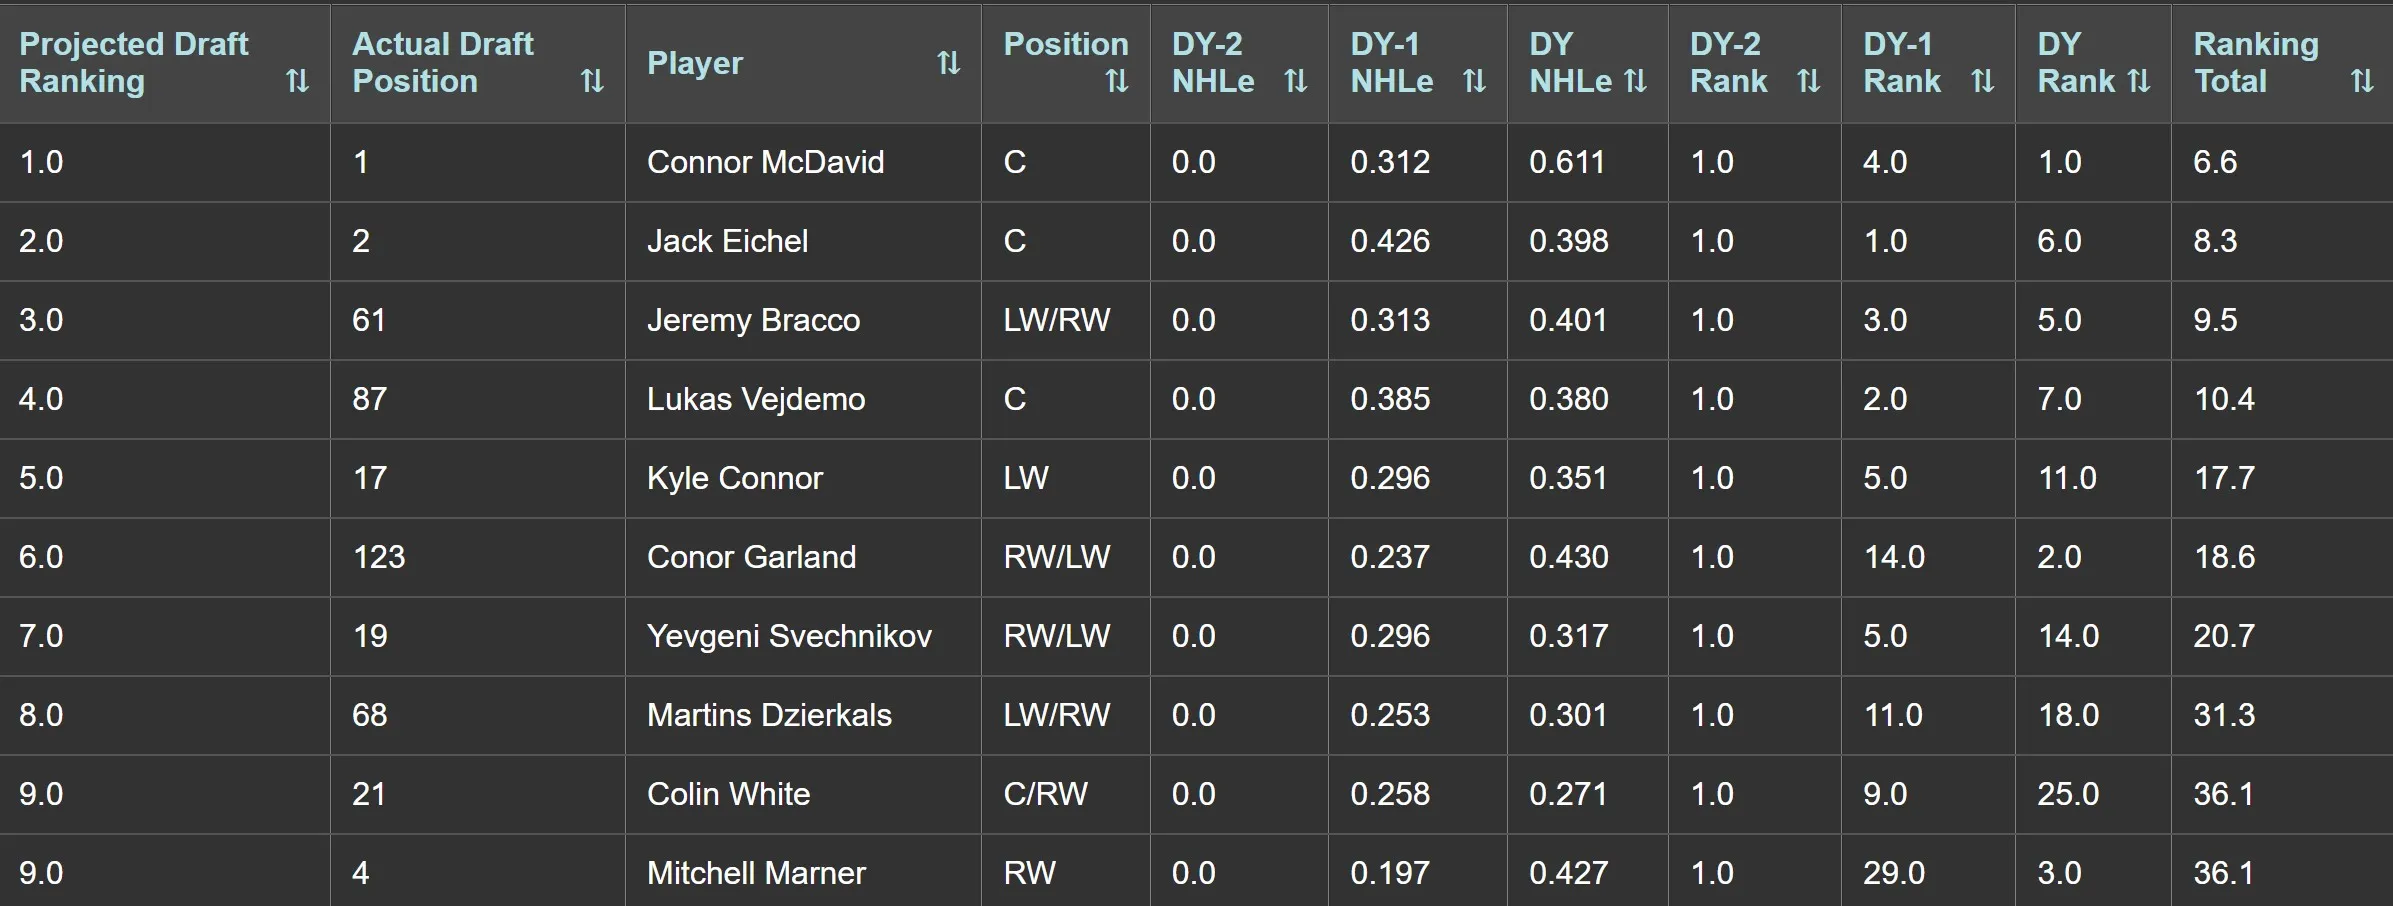
Here are the top 10 players in the 2015 NHL Draft class according to my rankings:

Complementing the interactive network dashboard, I’ve created a streamlined webpage for these rankings. It allows you to explore rankings in greater depth, covering draft classes from 2014 to the present. You can access the rankings here: https://nhle-rankings-ed113ff43119.herokuapp.com/
After analyzing the rankings some of my initial predictions were confirmed, but others were not:
-
Most of the high-octane point producers in the NHL today would show up at the top of my rankings, no matter where they were taken in the draft. For example, while I expected Connor McDavid and Jack Eichel to be ranked highly, David Pastrnak who may have been slightly overlooked in 2014, going 25th overall, was in the top 10 of my rankings for that year.
-
These rankings also highlighted potential “hidden gems”. Players that could become valuable contributors if given the opportunity. Yegor Sharangovich of the Calgary Flames has proven to be an extremely valuable top-6 forward contributing 59 points in 82 games last season. This was just 4 seasons after going 141st overall in 2018. In my rankings he comes in at 30th overall. A similar player is Kirill Marchenko. In his rookie season with the Columbus Blue Jackets, Marchenko burst onto the scene scoring 21 goals in just 59 games. In his second season, just last year, he put up 42 points in 78 games. 23 of those lighting the lamp. Yet he was only drafted 49th in the 2018 draft and he ranks 15th overall in my rankings. Then there is Viktor Arvidsson and Conor Garland, two players that have proven they should be on starting lineups in the NHL. Both were drafted outside of the top 100, but were in the top 10 of my rankings, suggesting they have outperformed their draft day expectations.
-
These rankings also aimed to identify potential “busts” – players who may have been overrated in the draft due to dominating weaker competition and nabbing a team’s first round draft pick. In theory, rankings based off NHLe should expose these types of players. However, I found that to not be the case, against my initial predictions. For example, Nolan Patrick who is a verified bust, retiring after the last season, shows up at #4 overall in my rankings after being drafted #2 overall in 2017.
-
The rankings also missed out on some very successful players. Jordan Kyrou and Robert Thomas of the St. Louis Blues. Two bona fide NHLers, who have both contributed multiple 70-point seasons. Both of which showed up outside the top 60 in my rankings.
My Final Thoughts
What does all this mean for my 2025 NHL Draft rankings? It suggests that many of the top ranked prospects will turn out to be potent point producers in the NHL, that much is obvious. It means there will also be overlooked prospects in these rankings that will develop into reliable NHLers over time. It also means that busts remain difficult to predict. Ultimately, pre-draft statistics aren’t enough alone to predict a prospect’s future NHL success or lack thereof. There is still a season to play before these prospects get their names called so we may gain further insight into these prospects, but the unpredictability of player development will always remain a factor.
It is important to clarify that NHLe rankings do not predict a player’s future NHL success. It is only the first step to an accurate data-driven prospect ranking. These rankings simply estimate a player’s “NHL readiness” based on their current point production in other leagues. The model does not account for potential growth or development. It does not consider the physical attributes, position, player type, or other factors, that can be used to more accurately value prospects. Additionally, due to this ranking being points based goalies are omitted and defensemen are severely undervalued.
In the future, I aim to address these limitations and provide a more comprehensive evaluation of NHL prospects. Hopefully for the Utah Hockey Club’s benefit. My next steps would involve developing models to accurately rank defensemen and goalies, by using statistics such as +/- and save percentage. Furthermore, by incorporating factors such as physical attributes, playing style, and developmental trajectories, the future iterations of these rankings will be better equipped to predict a prospect’s NHL potential. This approach could offer valuable insights for the club’s scouting and player development strategies.
The purpose of this analysis was initially to separate the statistically best prospects from the statistically average ones by putting all prospects on a level playing field no matter the league they play in. Providing some insight into prospects that could bring significant value to whatever team drafts them. Driving their team to success and bringing entertainment to their fans. While the rankings have achieved this to some extent, I hope this analysis encourages the further evaluation of some prospects who might otherwise be overlooked. After all, when deciding who to spend draft capital on, you don’t want to leave any stone unturned.
Finally, the game of ice hockey is not one determined just by statistics. The flow of play on the ice, combined with an erratic bouncing puck, momentum shifts, lineup compositions, and the wide variety of play styles, make for many unpredictable outcomes. This is what makes the game of hockey so exciting. It’s what keeps you on the edge of your seat for the entirety of the 60 minutes. As seen this past season in the Red Wings final games of the season, it is never over until the clock hits zero. Anything can happen. It’s why I love the game. I can provide statistics-based rankings for the prospects for the upcoming season that give insight into what a player may be like beyond the tape, but once the skates are laced up, nothing is certain.
My prospects to keep an eye on based on NHLe rankings:
- Ivan Ryabkin (1)
- James Hagens (2)
- Max Westergård (4)
- Michael Misa (6)
- Jakob Ihs-Wozniak (7)
- Viktor Klingsell (8)
- Vít Záhejský (10)
- Eric Nilson (11)
- Anton Frondell (12)
- Porter Martone (19)
- Jordan Gavin (24)
- L.J. Mooney (25)
- William Moore (34)
- Malcom Spence (35)
- Adam Benák (37)
- Luka Radivojevic (44)
- Bill Zonnon (45)
- William Horcoff (61)
- Sascha Boumedienne (68)
- Matthew Schaefer (9)
Links
- Network NHLe by CJ Turtoro - https://cj-turtoro.shinyapps.io/NNHLe-writeup/
- NHL Equivalency and Prospect Projections Models: Building the NHL Equivalency Model (Part 2) - https://towardsdatascience.com/nhl-equivalency-and-prospect-projection-models-building-the-nhl-equivalency-model-part-2-6f275a45e22
- Network of Leagues Dashboard - https://league-network-dashboard-d6ac64fae206.herokuapp.com/
- NHLe Draft Rankings – https://nhle-rankings-ed113ff43119.herokuapp.com/
